
Tracing
In the complex world of microservices and cloud-native architectures, understanding the journey of a request across various services becomes crucial. Distributed tracing fills this need, offering visibility into the interactions and performance across microservices. Let's simplify what distributed tracing is and how it enhances observability.
What is Distributed Tracing?
Distributed tracing tracks and visualizes the path that a request takes as it travels through a system of microservices. It captures detailed information about the operations performed by each service on the request's path, including timing, success, and failure of each operation, known as spans.
Trace: A single operation or a series of operations to fulfill a request, represented as a collection of spans.
Span: A named, timed operation representing a piece of the workflow. Spans include metadata such as start and end times, tags, and logs, forming a detailed picture of the request's journey.
Why Distributed Tracing?
Visibility: Offers insights into the performance and behavior of microservices, helping identify latency issues and failures.
Debugging: Simplifies troubleshooting by highlighting the path and context of requests, making it easier to pinpoint problems.
Performance Optimization: Identifies bottlenecks and inefficiencies in the request flow across services.
Tracing Systems: Jaeger
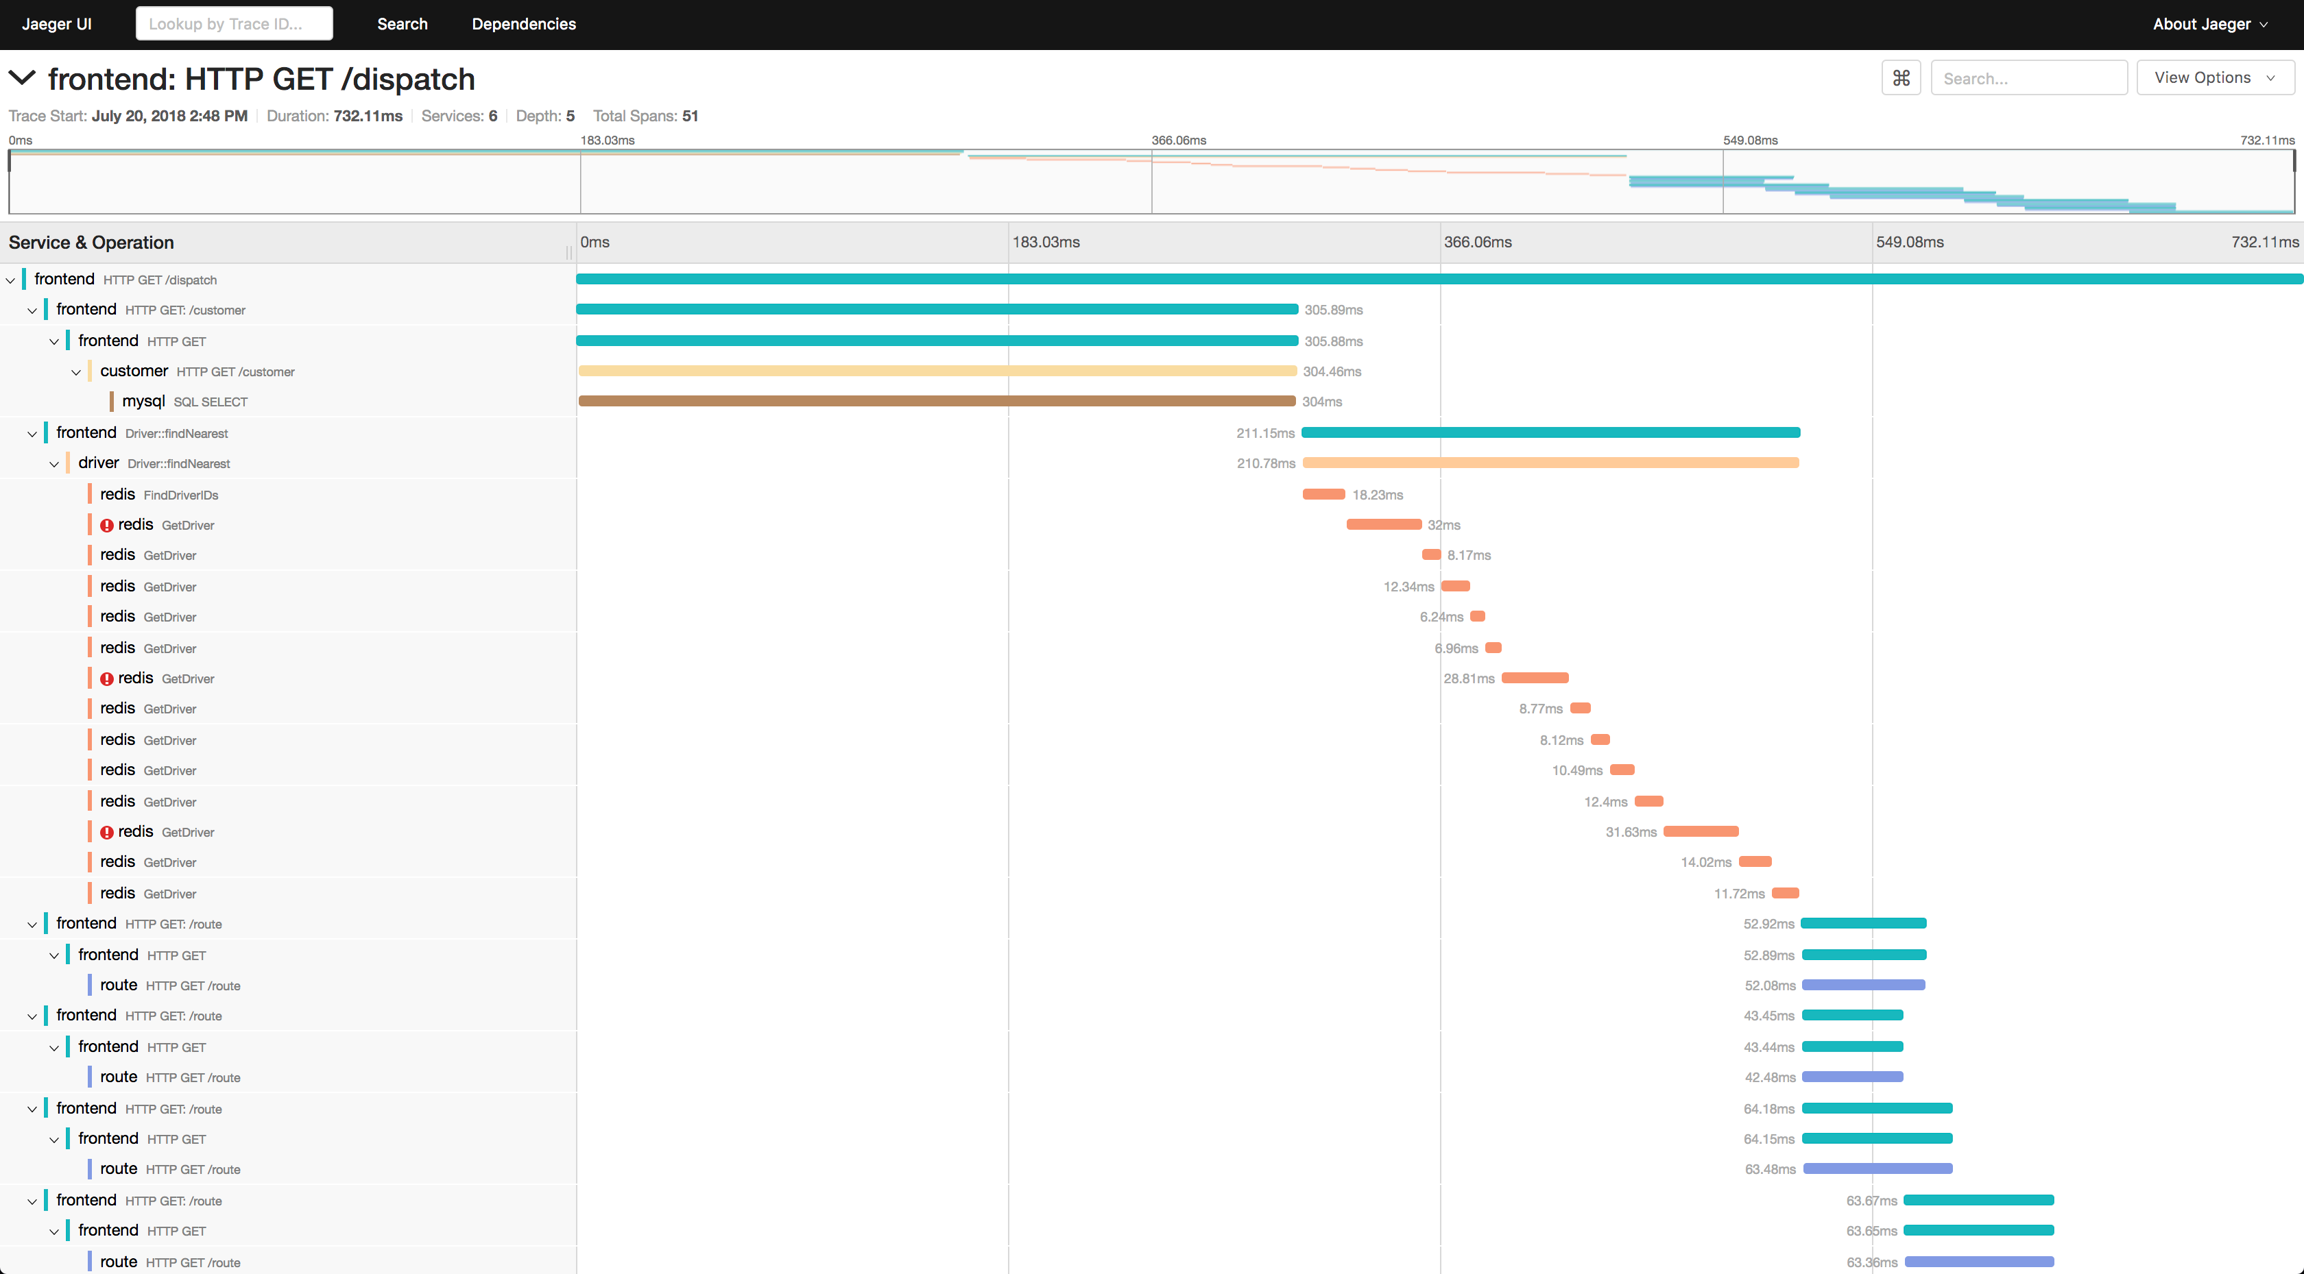
Jaeger, a CNCF project, is a widely used tracing system that collects, stores, and visualizes traces. It provides a detailed view of trace data, helping teams understand how requests are processed within their microservice architecture.
Features: Jaeger offers a rich UI for exploring traces, enabling developers and operators to drill down into the details of individual traces and spans, understanding the timing and sequence of operations.
OpenTelemetry: The Unified Standard
OpenTelemetry merges the efforts of OpenTracing and OpenCensus into a single, unified project under the CNCF. It aims to standardize the generation, collection, and management of telemetry data (metrics, logs, and traces).
Components: Offers APIs, SDKs, and tools for integrating telemetry into applications and infrastructures. It supports exporting telemetry data to various backends, including Jaeger, in a standardized format.
Goal: To make observability a built-in feature of cloud-native applications, facilitating the collection and analysis of telemetry data across different platforms and languages.
Last updated