
Prometheus
Prometheus, an open-source monitoring tool that became part of the Cloud Native Computing Foundation (CNCF) in 2016, has emerged as a preferred solution for monitoring containerized applications and infrastructures, especially in Kubernetes environments. Let’s simplify what Prometheus is and how it works.
What is Prometheus?
Prometheus is designed to collect and store metrics as time-series data—data points marked with timestamps, labels (which categorize or add metadata to metrics), and the actual metric value. This model is particularly adept at capturing the dynamic nature of container-based systems.
Core Metrics Types
Prometheus tracks several types of metrics to capture a comprehensive view of system behavior:
Counter: A metric that only increases, useful for tracking occurrences of specific events, like the number of requests received.
Gauge: A metric that can go up or down, suitable for measuring values like temperature or current memory usage.
Histogram: A metric that samples observations (e.g., request durations or response sizes) and counts them in configurable buckets.
Summary: Similar to histograms but also provides total counts and sum of the observed values.
How Does Prometheus Work?
Metric Collection
Applications expose metrics at an HTTP endpoint (typically /metrics), where Prometheus can scrape them at defined intervals. Client libraries available for languages like Go, Java, Python, and Ruby facilitate this by generating metrics automatically.
Example of Exposed Metrics
Kubernetes Integration
Prometheus seamlessly integrates with Kubernetes, auto-discovering services to monitor. It stores scraped metrics in its time-series database, allowing for efficient data querying and analysis.
Querying Data with PromQL
PromQL, Prometheus’s powerful query language, lets users select, filter, and aggregate time-series data in real-time. Whether through simple label filtering or complex calculations, PromQL facilitates deep insights into application and infrastructure performance.
Examples
Visualization and Alerting
Grafana Integration
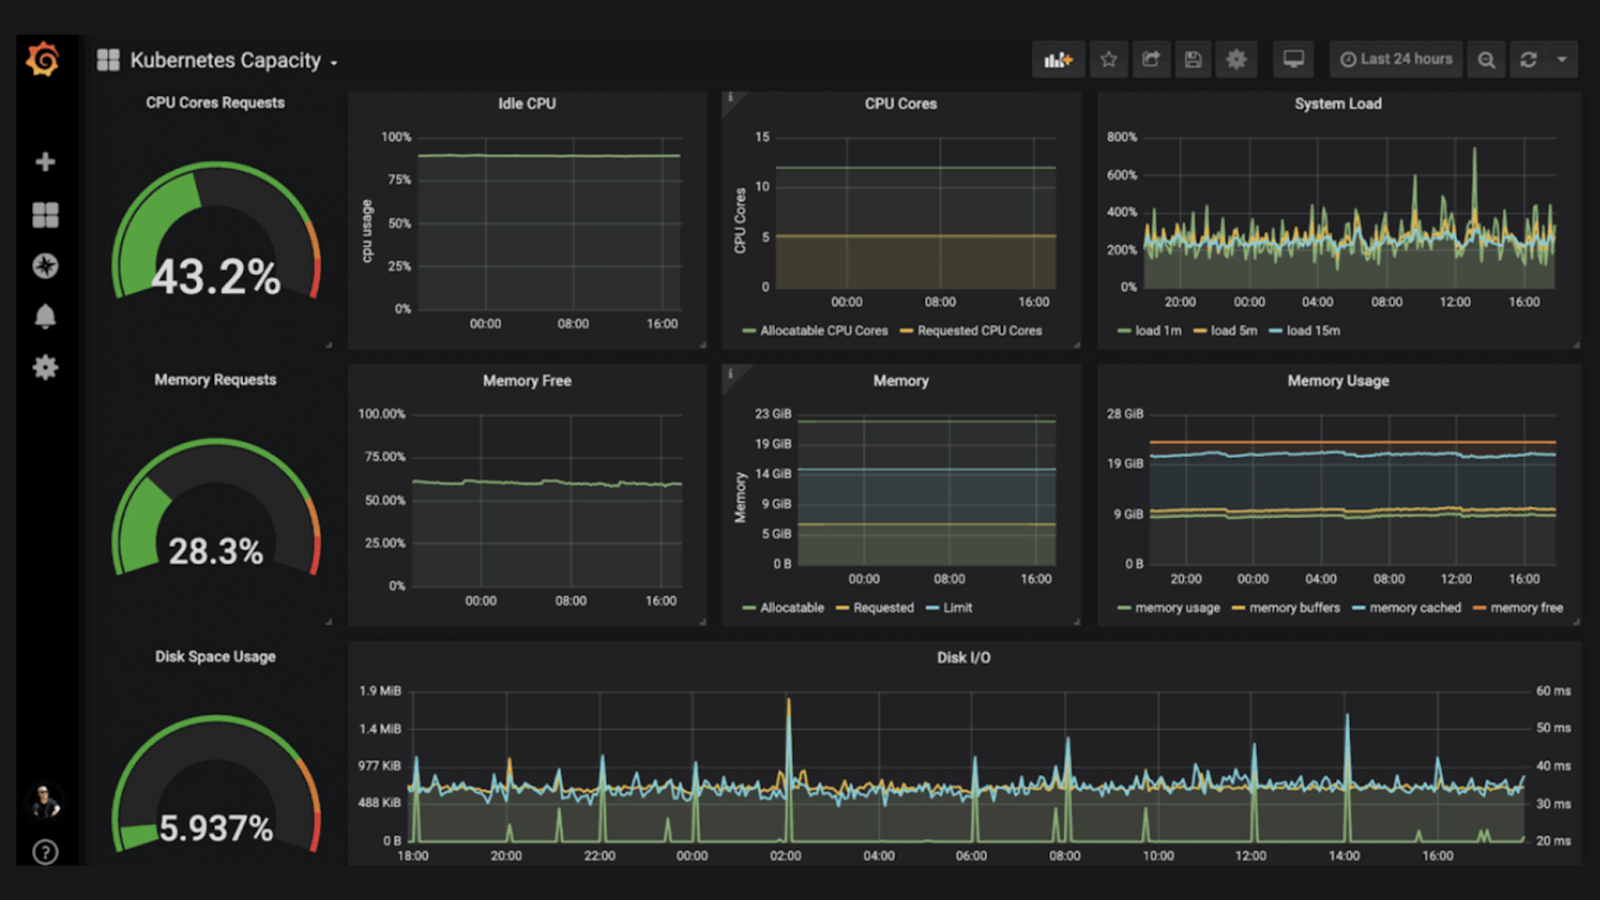
While Prometheus provides basic visualization capabilities, Grafana is commonly used to construct more elaborate dashboards. Grafana supports multiple data sources, including Prometheus, allowing for rich, customizable visualizations of your metrics.
Alertmanager for Alerts
Prometheus can trigger alerts based on defined conditions, which are then managed by Alertmanager. Alertmanager handles notifications, sending them through various channels like email, chat applications, or dedicated on-call management tools.
Alerting Rule Example
Last updated